


Field Service Report
Field Service Report (FSR) was an application module that was part of a larger application called Field Vision. FSR was a reporting form used by Field Engineers to provide detailed descriptions and images of maintenance and repairs made to Turbines and Generators.
As a key member of the development team, I was responsible for designing report form, dashboards and navigation to FSR. I ensured that all FSR forms were designed to meet specific guideline regulations, ensuring they were accepted by project managers. This critical component enabled Field Engineers to create, edit and monitor the status of their reports.
Main Dashboard
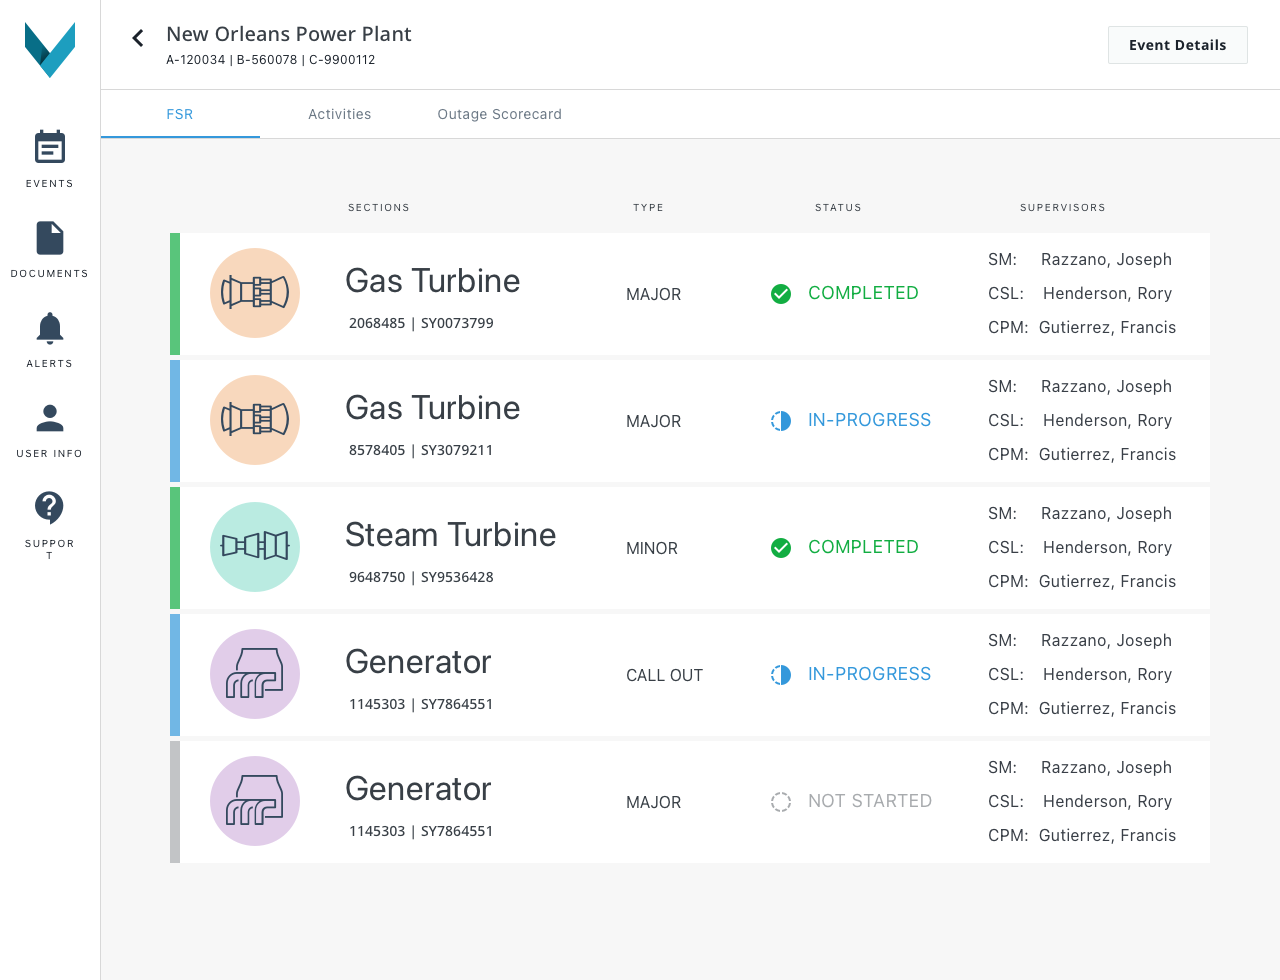
To access the Field Service Report’s (FSR) main dashboard, users began by selecting a location.
Once there, we aimed to provide a comprehensive display of all report forms related to that particular location. This encompassed report forms for each piece of equipment at the location, as well as quick access to vital information such as status, report type, and a list of supervisors associated with the report.
The main dashboard served as a centralized hub, granting users access not only to field service reports but also to the activities board, outage schedule, and specific details pertaining to the chosen location.
Information Modal
While on the main dashboard, users needed a way to quickly access important site information and documents. This came in the way of a tabular pop-up modal, accessed by selecting the “Event Details” button in the top right hand corner on the dashboard page. The modal would display 3 key areas users expressed needs in.
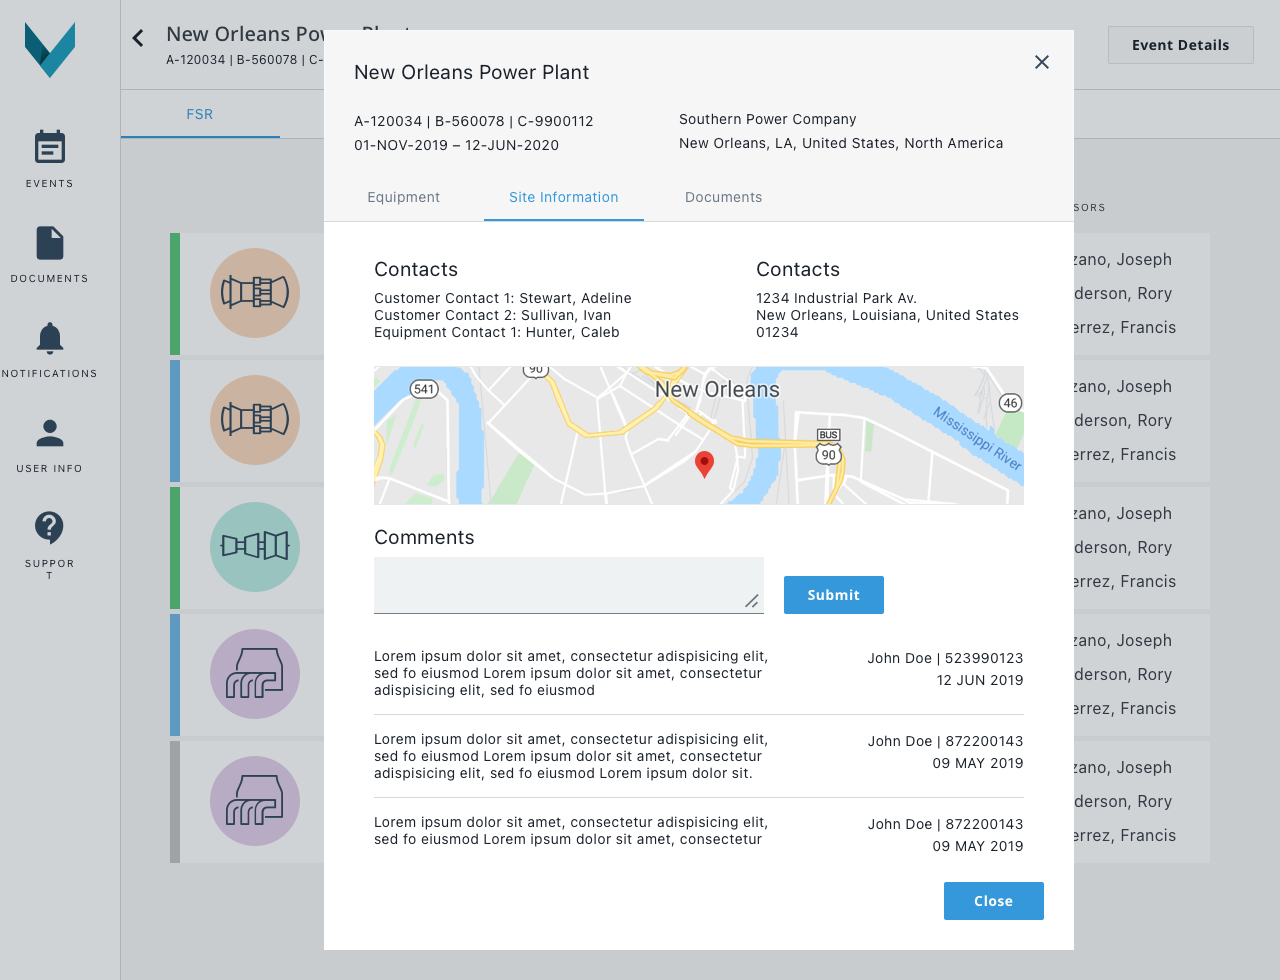
The second tab of the modal is the site information area. This area displays all of the site contacts, address and map location, and comments about the site.
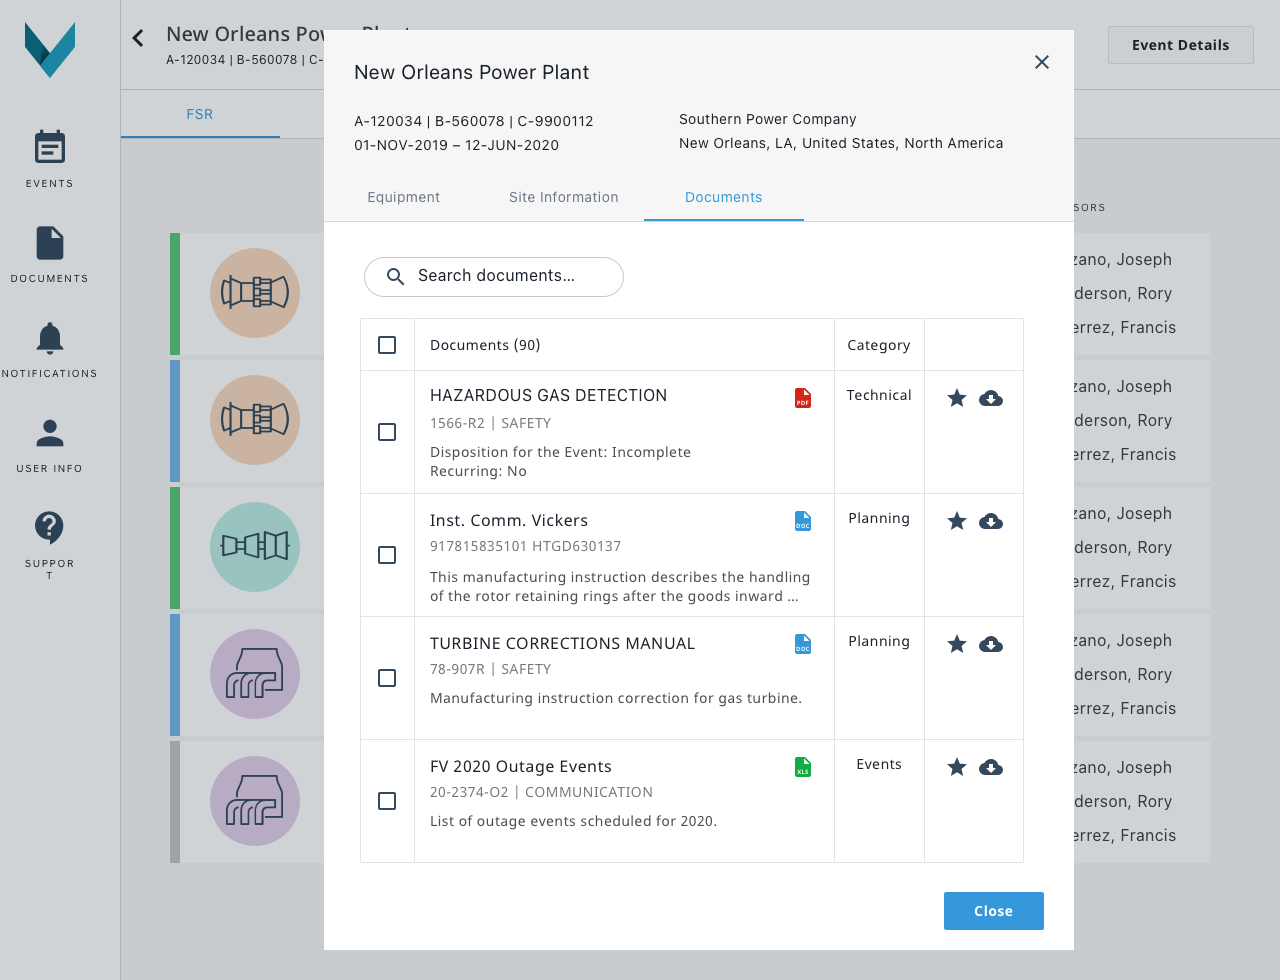
The last tab of the modal is the documentation area. This area gives quick access to all documents associated with the site and gives the ability to download them.
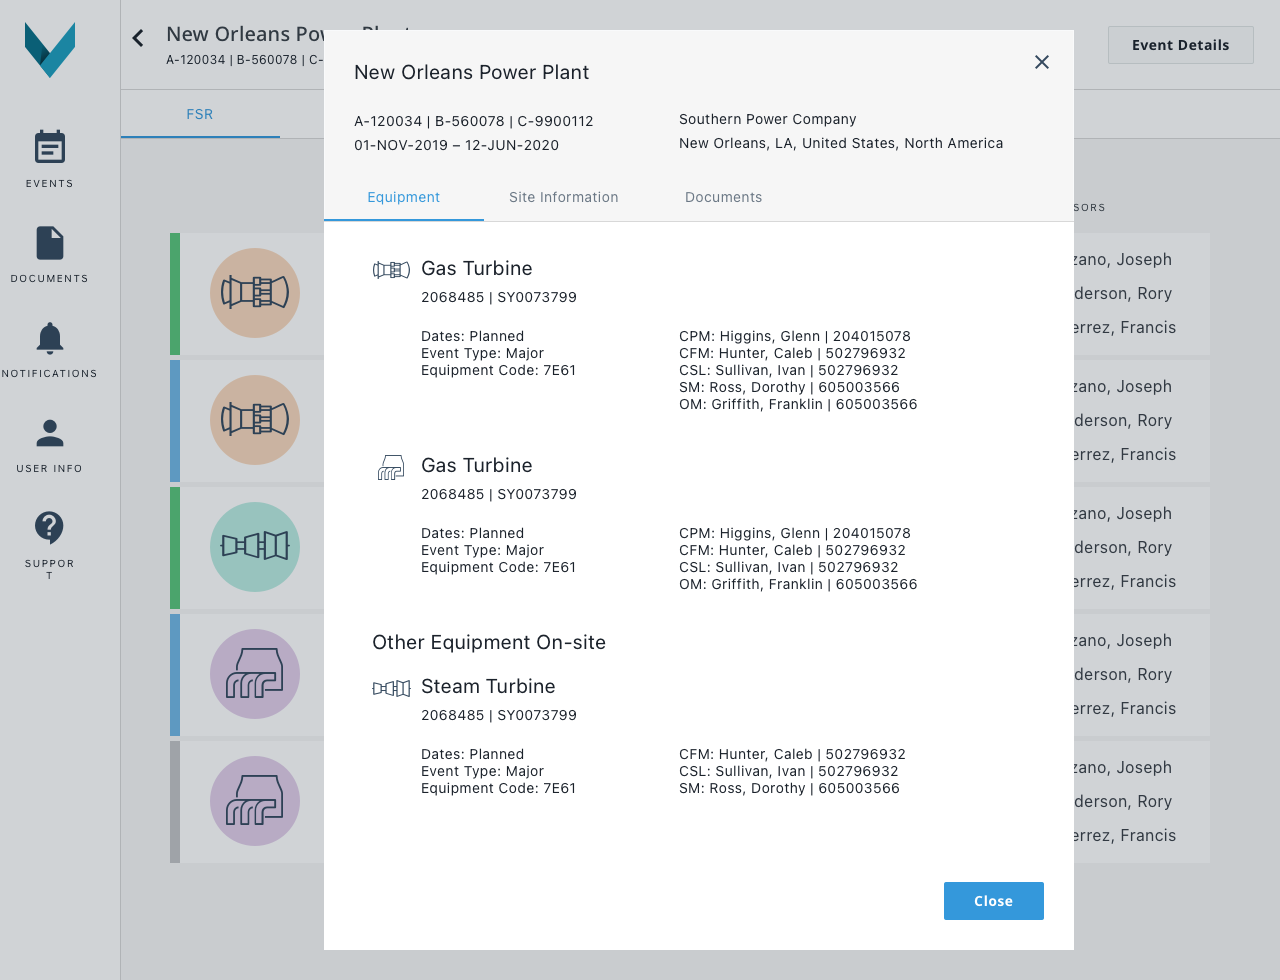
The first tab of the modal would be the equipment area. This would display all of the piece of equipment located at the site as well as the personnel assigned to each equipment.
Activities Dashboard
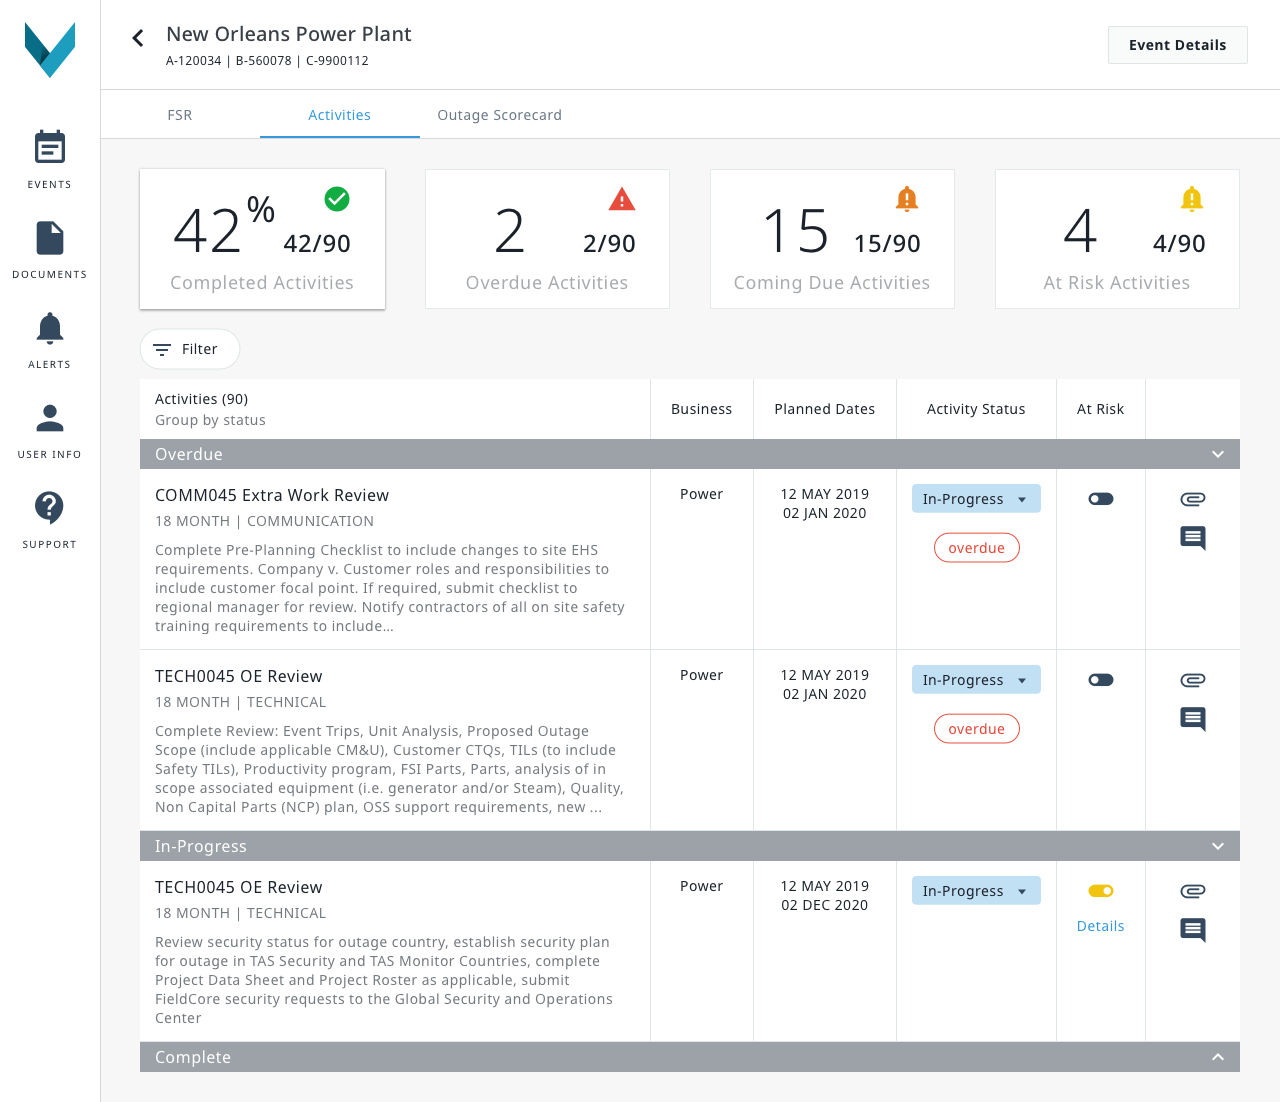
The activities dashboard offered a comprehensive list of all ongoing activities at the location, gathering information from various sections of the entire site.
Specifically designed for supervisors and project administrators, this section provided them with essential high-level details. These included a complete activity listing, a percentage of completed activities, overdue and at-risk activities, and a count of activities nearing their due dates.
In addition to important statuses, this area also granted users access to planned date ranges, business areas, and a wide range of interactive features. These interactions encompassed the ability to update activity progress statuses, download attachments, leave comments, and flag activities at risk.